1Introduction:
2Study Area:
Region: Pabbi, Khyber Pakhtunkhwa, Pakistan
Boundary Input: Digitized polygon shapefile of Pabbi region
Reference Data: Labeled ground truth points collected for key land and crop classes
3Data Used:
Satellite Imagery: COPERNICUS/S2_SR_HARMONIZED (Sentinel-2 Surface Reflectance)
Date Range: Sept 1, 2024 – Mar 31, 2025
Cloud Filtering: Less than 10% cloud cover
Spectral Bands Used: B2 (Blue), B3 (Green), B4 (Red), B8 (NIR), B11 (SWIR1), B12 (SWIR2)
Derived Indices: NDVI, UI (Urban Index), NDWI (Water Index), BUI (Built-up Index)
Texture Features from NDVI (GLCM): Entropy, Variance, Contrast, Correlation, Dissimilarity, Shade, IDM
4Land and Crop Classes:
Wheat ( Class 1 )
Persian Clover ( Class 2 )
Sugarcane ( Class 3 )
Built-up ( Class 4 )
Barren Land ( Class 5 )
5Methodology:
5.1Preprocessing:
Filtered Sentinel-2 imagery by date, region, and cloud cover. Created a median composite and calculated all spectral indices. Applied GLCM texture analysis on NDVI.
5.2Training Data:
Merged ground truth points from five land cover types. Sampled image values at point locations using .sampleRegions(). Split data into 70% training and 30% testing.
5.3Classification:
Model Used: Random Forest (200 trees). Features used: Spectral bands, indices, and texture features. Also compared results with SVM (Support Vector Machine), which underperformed.
5.4Validation:
Accuracy Assessment using a Confusion Matrix. Overall Accuracy (RF): 83.45%. Visual verification on classified map. Confusion Matrix here......
6Output:
Classified Map with 5 land cover and crop types
Confusion Matrix and Feature Importance printed in GEE
Exportable RGB GeoTIFF for further GIS analysis
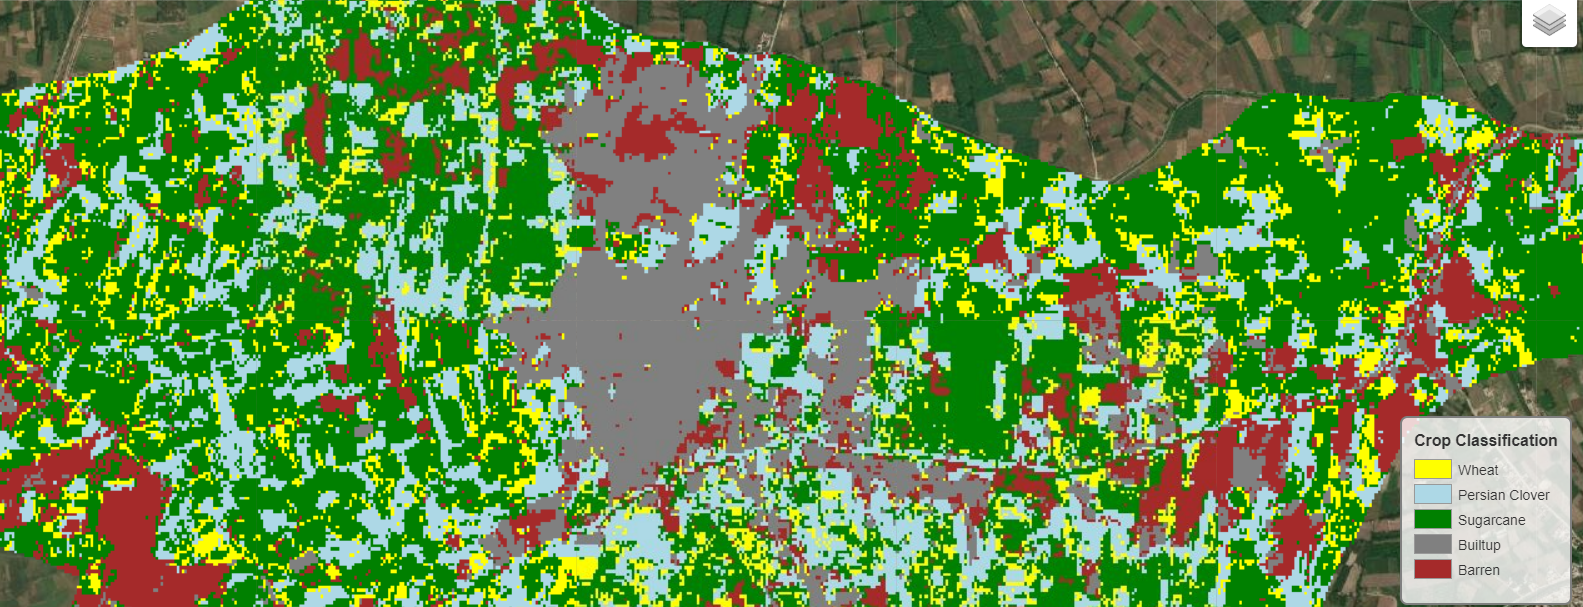
Figure 1:Pabbi Land Cover and Crops Classification Image
7Results:
7.1Confusion Matrix
| Actual \ Predicted | Wheat | Persian Cloove | Sugarcane | Builtup | Barren |
|---|---|---|---|---|---|
| Wheat | 91 | 20 | 20 | 0 | 0 |
| Persian Clove | 16 | 167 | 17 | 1 | 7 |
| Sugarcane | 15 | 42 | 234 | 0 | 11 |
| Builtup | 5 | 1 | 1 | 190 | 5 |
| Barren | 3 | 2 | 9 | 10 | 251 |
7.2Overall Accuracy:0.8345
8Key Takeaways:
Texture features significantly improved classification accuracy
RF outperformed SVM for this dataset and geographic context
GEE proved efficient for processing large-scale multispectral data
9Future Work:
Future Work
Implement time-series classification using phenological changes
Test Transformer-based models and Segment Anything (SAM)
Automate land cover change detection over multiple seasons
import leafmap.foliumap as leafmap

# Initialize the map
m = leafmap.Map(zoom=15)
m.add_basemap("SATELLITE")

# Define your COG and basemap
left = "https://github.com/code4geoai/pabbi/releases/download/2/Crop_Classified_With_Alpha_COG.tif"
right = "Esri.WorldImagery"

# Colormap with string keys
colormap = {
    "1": '#ffff00',  # Wheat
    "2": '#add8e6',  # Persian Clover
    "3": '#008000',  # Sugarcane
    "4": '#808080',  # Built-up
    "5": '#a52a2a',  # Barren
}

# Add split map first
m.split_map(
    left_layer=left,
    right_layer=right,
    left_args={
        "colormap": colormap,
        "nodata": 0,
    },
    right_args={
        'opacity':0.3
    },

    left_label="Crop Classification",
    right_label="Satellite Imagery"
)
maplegend = {
    "Wheat":                '#ffff00',  # Wheat
    "Persian Clover":       '#add8e6',  # Persian Clover
    "Sugarcane":            '#008000',  # Sugarcane
    "Builtup":              '#808080',  # Built-up
    "Barren":               '#a52a2a',  # Barren
}
m.add_legend(
    title="Crop Classification",
    legend_dict=maplegend,
    position="bottomleft",
)

 # Then add your GeoJSON boundary on top of both sides
geojson_url = "https://raw.githubusercontent.com/code4geoai/gee/main/pabb_crop_V3.geojson"
m.add_geojson(
    geojson_url,
    layer_name="Boundary",
    style={"color": "green", "weight": 0.5, "fillOpacity": 0.1,},
    visible=False,
    zoom_to_layer=True,
)

m
import leafmap.foliumap as leafmap
m = leafmap.Map(zoom=15)
#adding an image to the map
m.add_basemap("Esri.WorldImagery")
file = 'https://github.com/code4geoai/pabbi/releases/download/2/Crop_Classified_With_Alpha_COG.tif'
# Titiler end point at hugging face
titiler_endpoint = "https://imhayatkhan-hayat-titiler.hf.space"
# 2. Public S3 COG URL
cog_url = "https://pabbiimagery.s3.eu-north-1.amazonaws.com/pabbi_satellte_image_COG.tif"

colormap = {
    1: '#ffff00',      # yellow - Wheat
    2: '#add8e6',      # lightblue - Persian Clover
    3: '#008000',      # green - Sugarcane
    4: '#808080',      # grey - Built-up
    5: '#a52a2a',      # brown - Barren
}
# Adding satellite imagery
m.add_cog_layer(
    url=cog_url,
    titiler_endpoint=titiler_endpoint,
    bands=[1, 2, 3],        # RGB order
    rescale="0,255",        # adjust if needed
    name="Pabbi COG (S3)",

)

m.add_cog_layer(
    file,
    name="Crop Classification",
    colormap=colormap,
    nodata=0
)


# adding Legend
maplegend = {
    "Wheat":                '#ffff00',  # Wheat
    "Persian Clover":       '#add8e6',  # Persian Clover
    "Sugarcane":            '#008000',  # Sugarcane
    "Builtup":              '#808080',  # Built-up
    "Barren":               '#a52a2a',  # Barren
}

m.add_legend(
    title="Crop Classification",
    legend_dict=maplegend,
    position="bottomleft",
)
m